Order flow
Every trade, with its side.
Read the activity inside the bar.
Built for Windows · Private testing
Footprint, profiles and order flow for index futures.
A closer view of the market, in one workspace.
 DeepAlpha ES · 1m
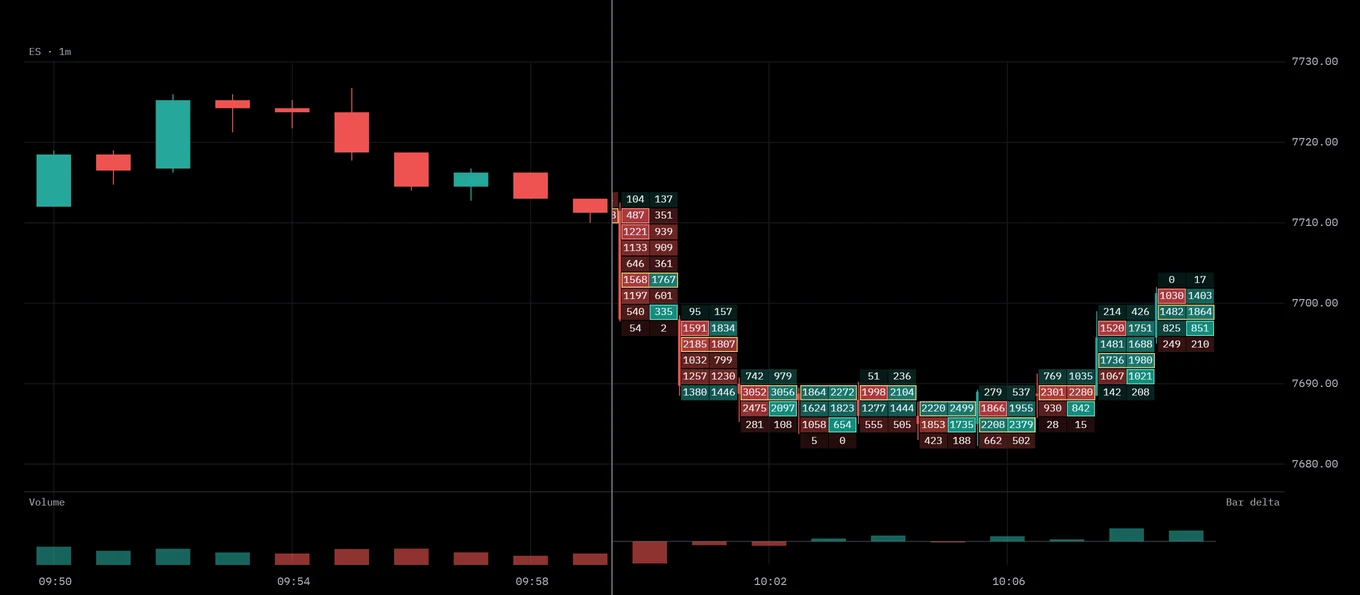
Markets, data and prop rules inside DeepAlpha
 E-mini S&P 500

 E-mini Nasdaq-100
 Micro E-mini

Every trade, with its side.
Read the activity inside the bar.
From 1 minute to Daily.
The same workspace at every scale.
ES, NQ, MES and MNQ.
E-mini and Micro index futures.
Any recorded day.
Future bars stay hidden.
Price is the result. Order flow lets you look at the trades behind it: volume at the bid and ask, large prints and the way activity builds at each price.
Open the footprint, follow cumulative delta or build a profile. Each is a different view of the same market, kept together on your chart.
Use points of control, value areas and session levels to put that activity in context. Reference points drawn from real trades.
DeepAlpha is a native Windows application built around index futures. Charts, profiles and order-flow studies share one workspace.
Move between nine timeframes, inspect a single candle or profile a range you choose. Keep the session’s levels in view as you work.
Then return to a recorded day. Replay it bar by bar, with future bars hidden, and practise with simulated account rules.
Inside DeepAlpha
From the individual trade to the shape of the session.
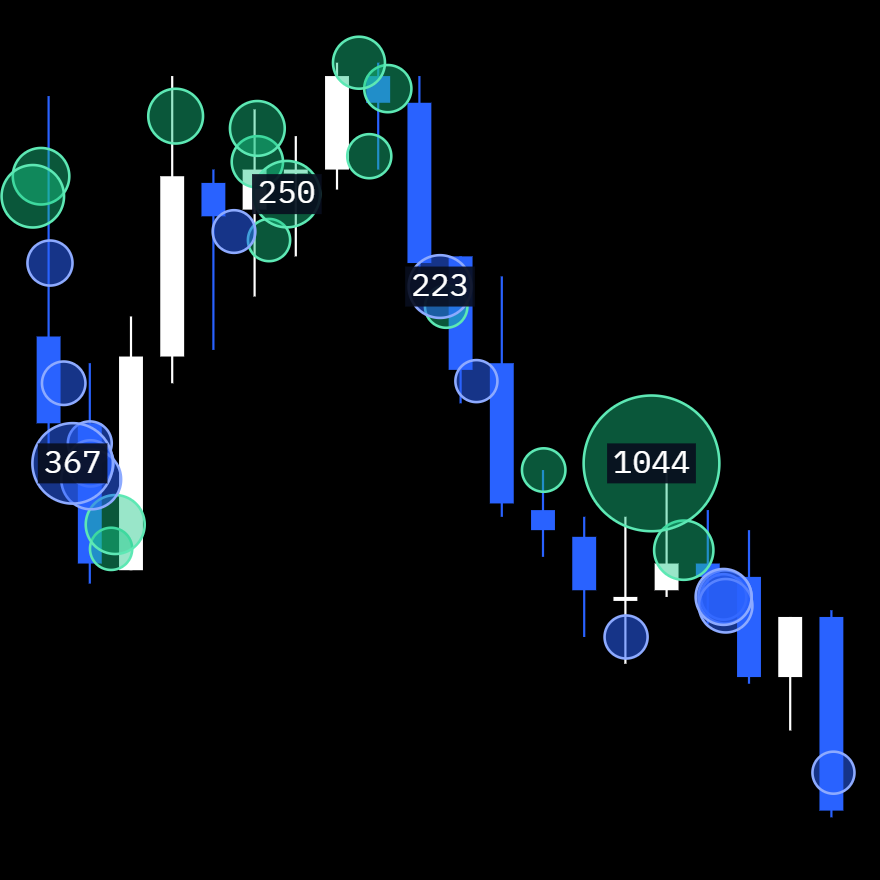
Grouped sweeps, drawn where they reached. The Order Flow layer reads stop runs, icebergs and absorption from trades and the best bid and ask.
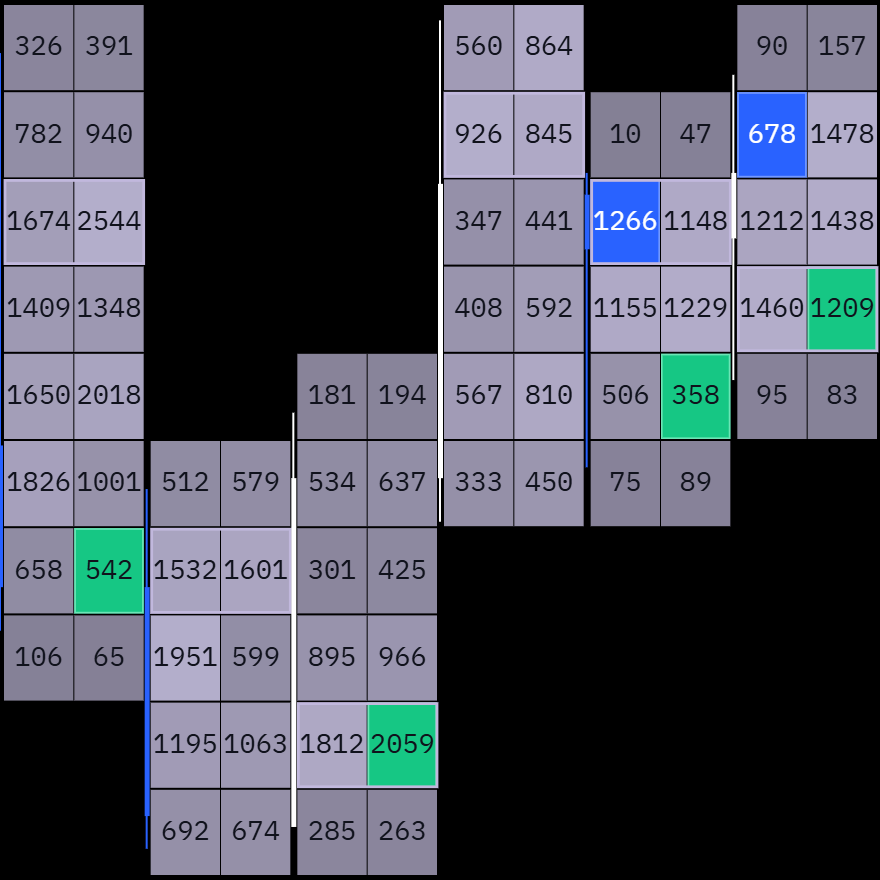
Bid and ask at every price inside the candle. See the volume, diagonal imbalances and bar POC.
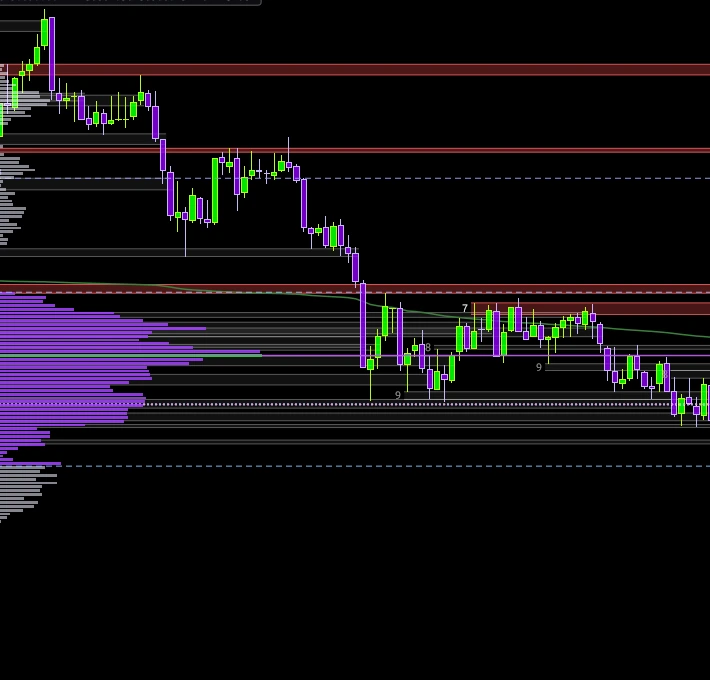
Session, composite and drag profiles. Keep POC, value area and low-volume nodes in view.
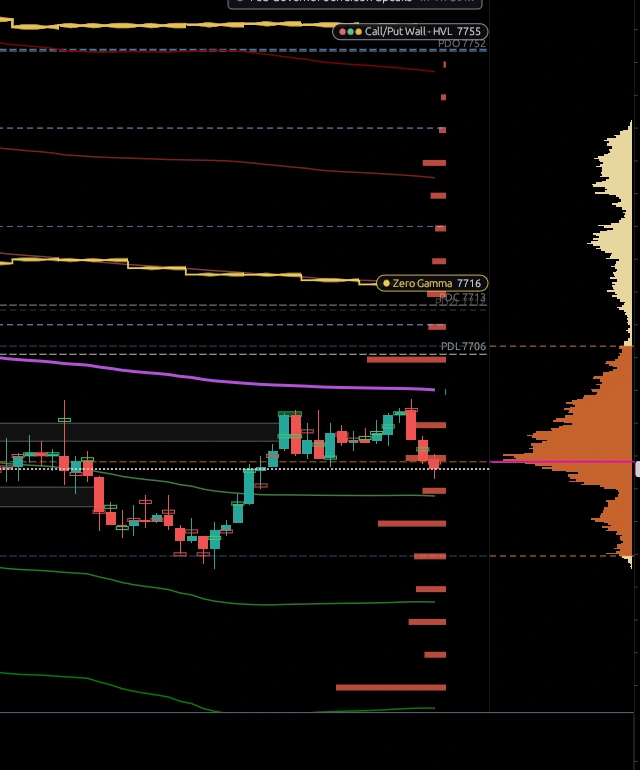
Dealer gamma levels and net GEX by strike, drawn from Cboe options data.

Bid and ask in shaded price rows, with diagonal imbalances and bar POC.
| Price | Bid | Ask |
|---|
The study library
Explore the studies inside the DeepAlpha workspace.
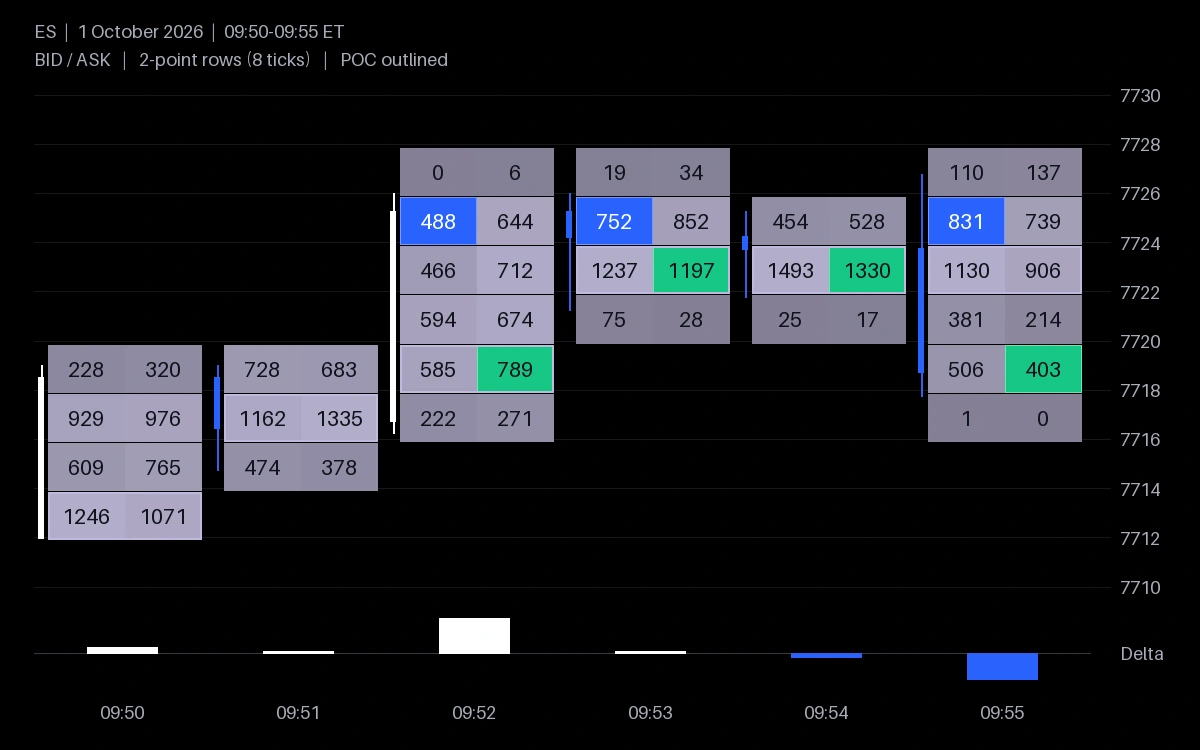
Bid and ask volume at each price, with diagonal imbalances and a delta bar.
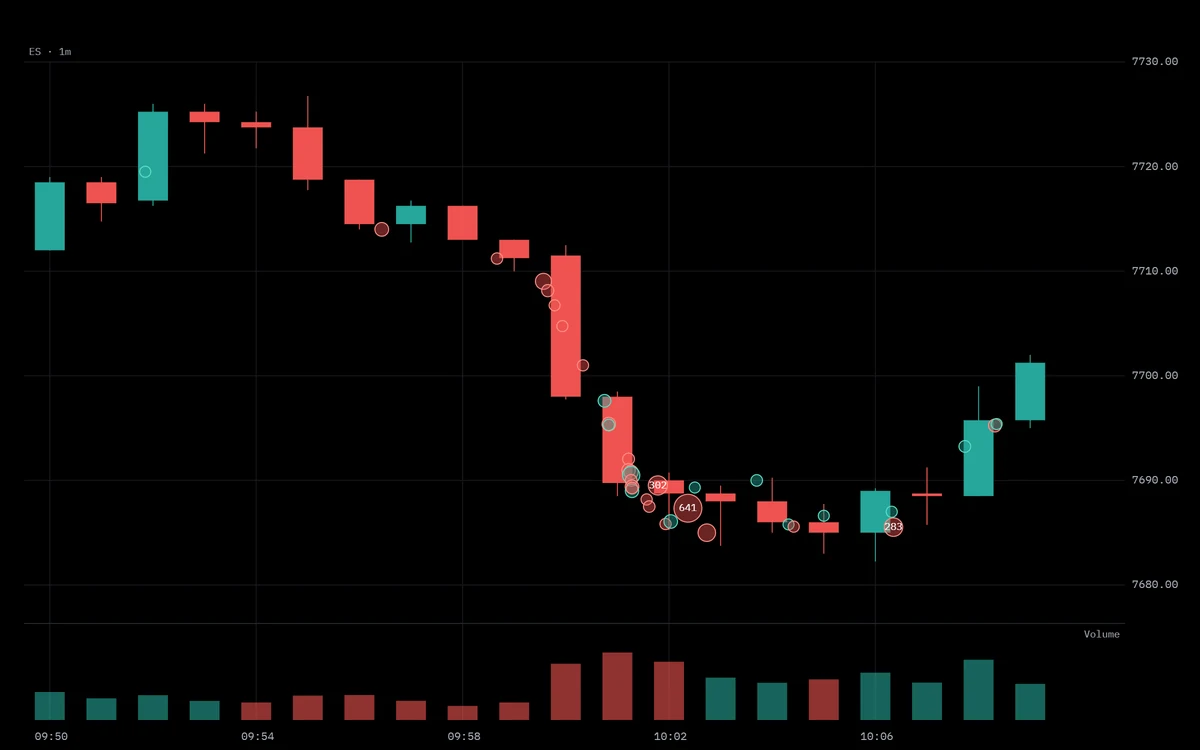
Aggressive sweeps grouped trade by trade and marked at the price they reached.
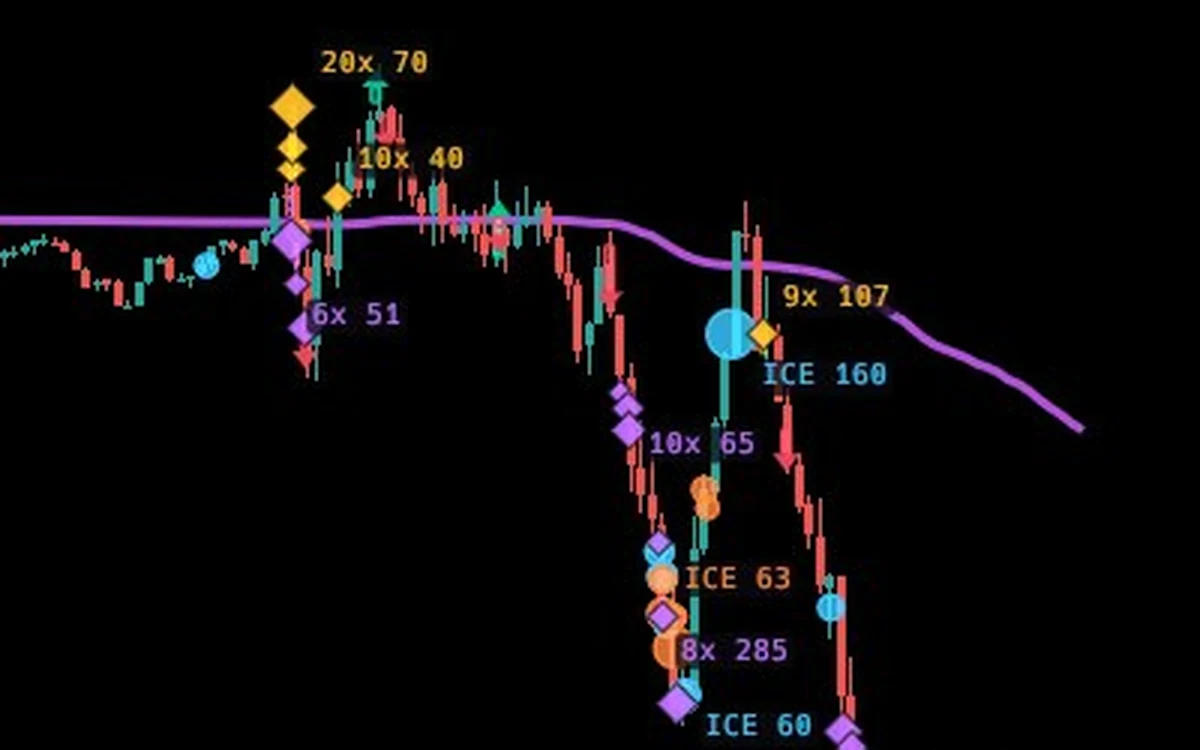
Read sweeps, stop runs, icebergs and absorption from trades and the best bid and ask.
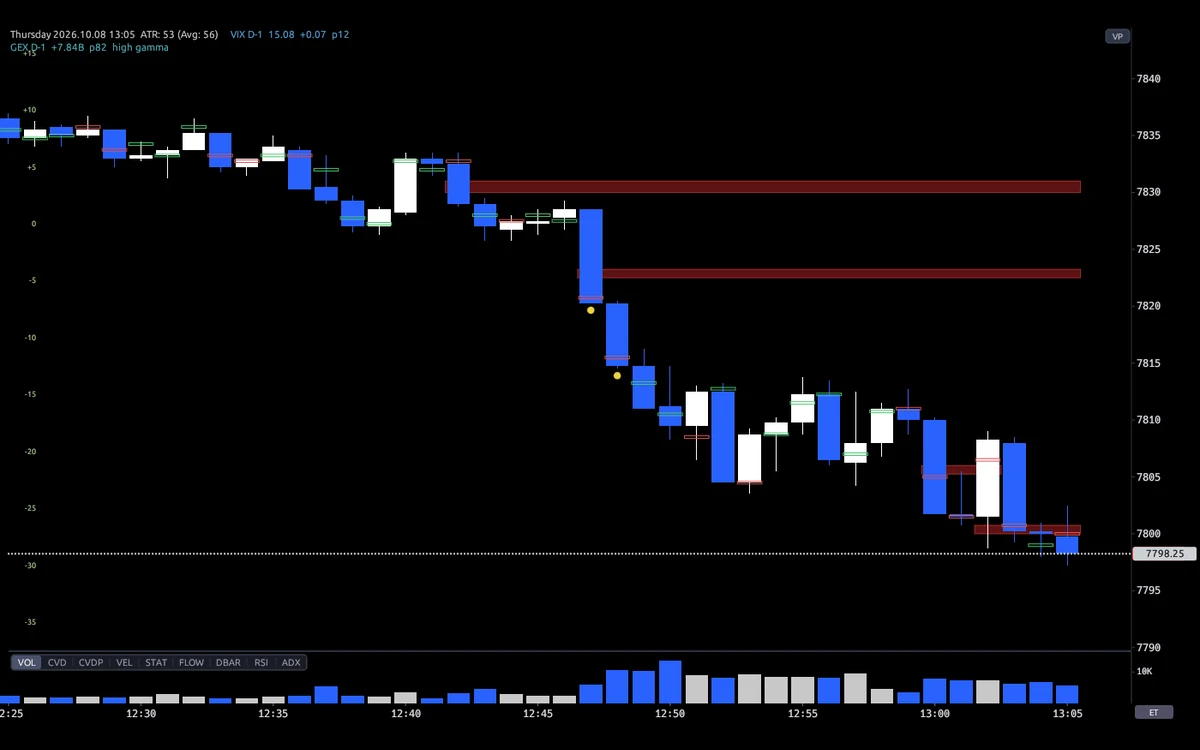
Three or more stacked imbalances, each candle’s POC and absorption candles.
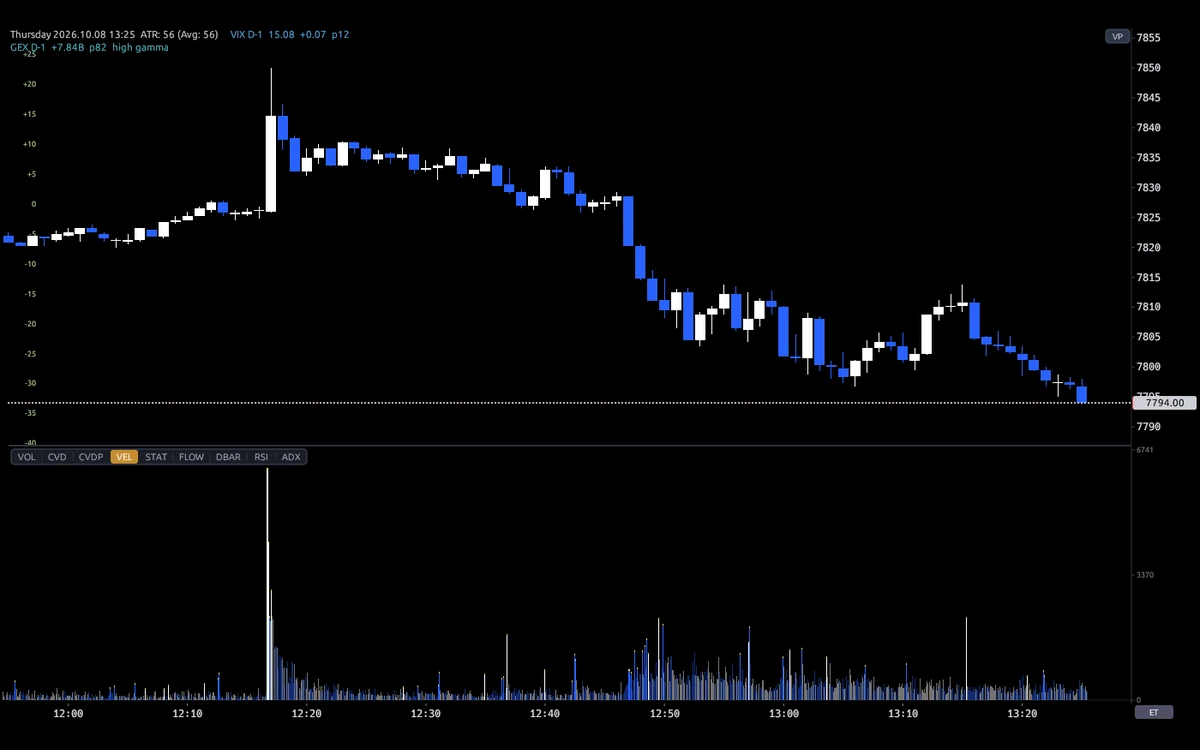
Volume in short windows, with bursts above two standard deviations highlighted.
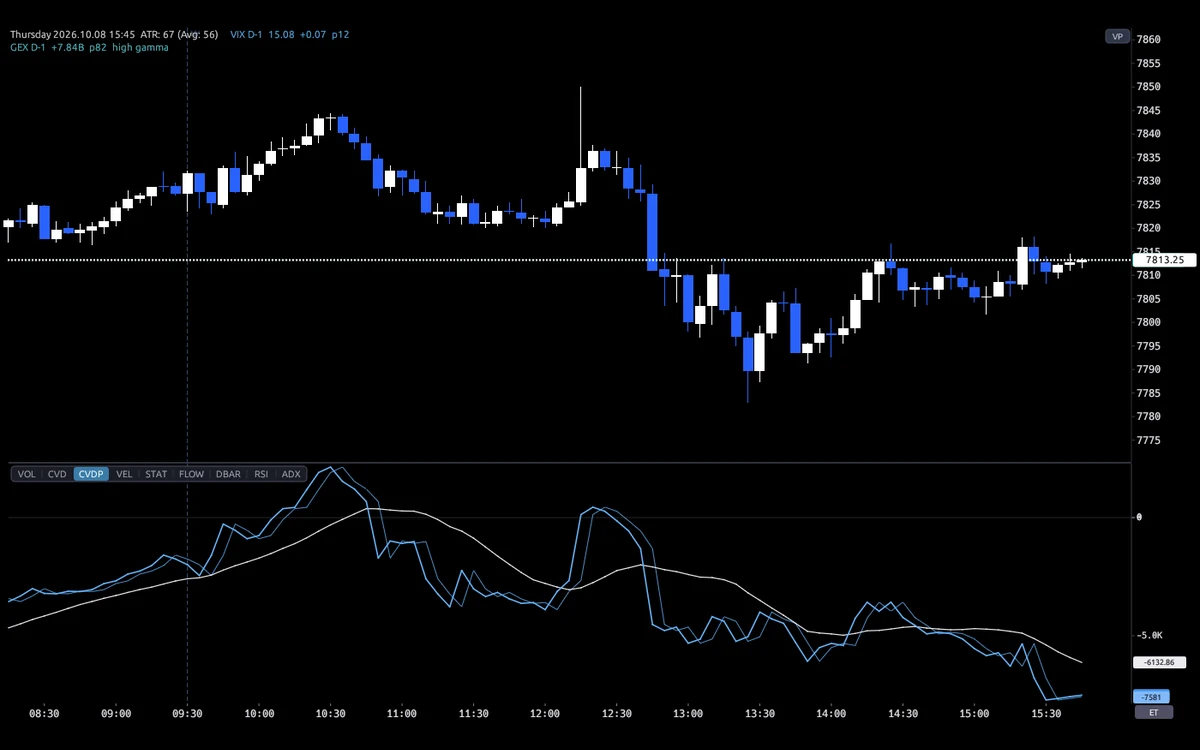
Cumulative delta as candles or a line, plus each bar’s delta and intrabar range.
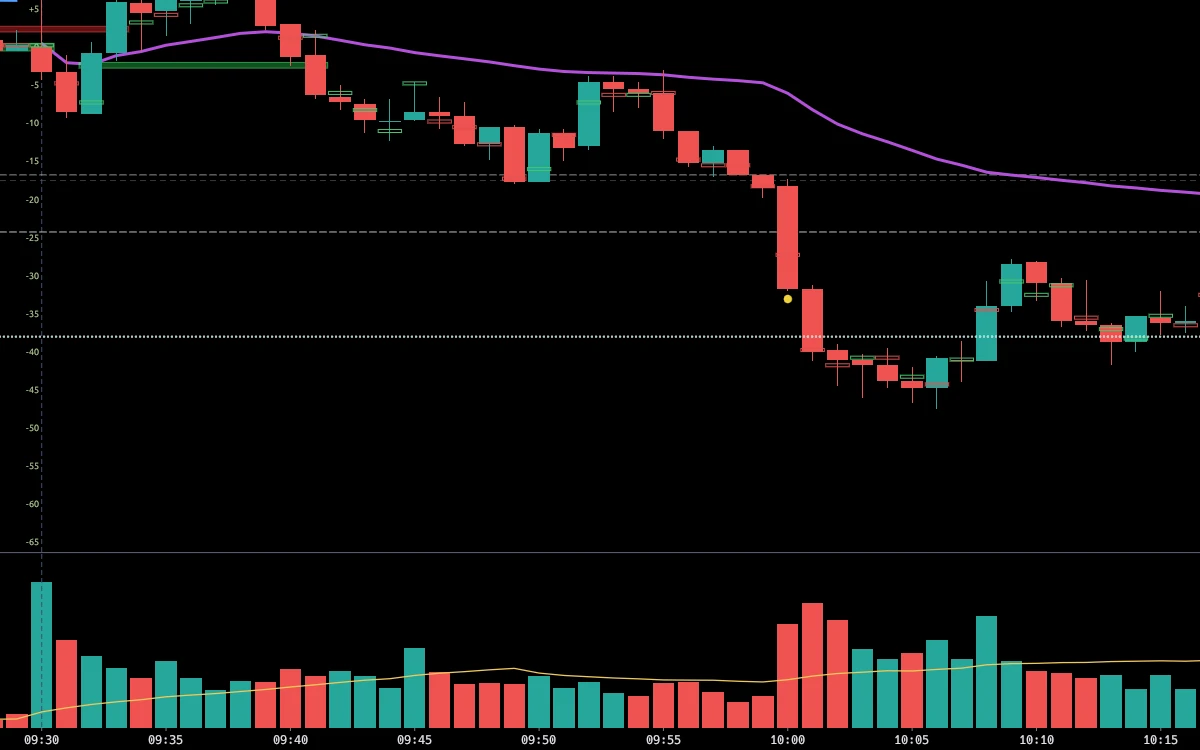
Volume coloured by delta, alongside its 20-period average.
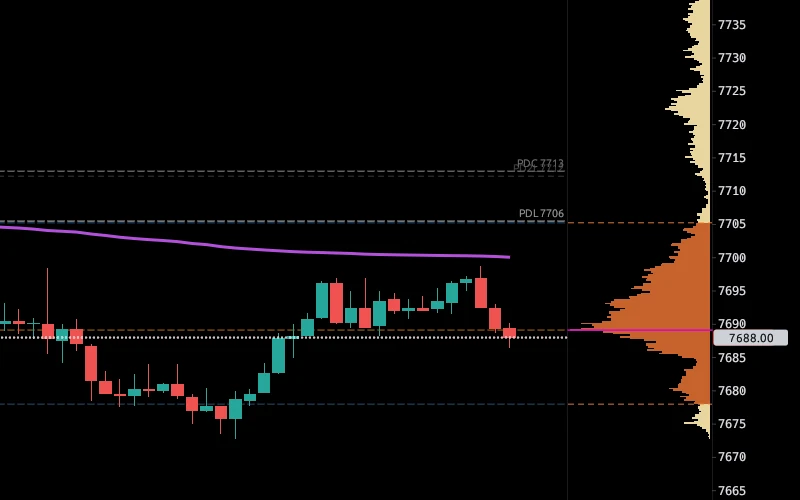
Tick-resolution Asia, RTH or visible-range profiles with POC and value area.
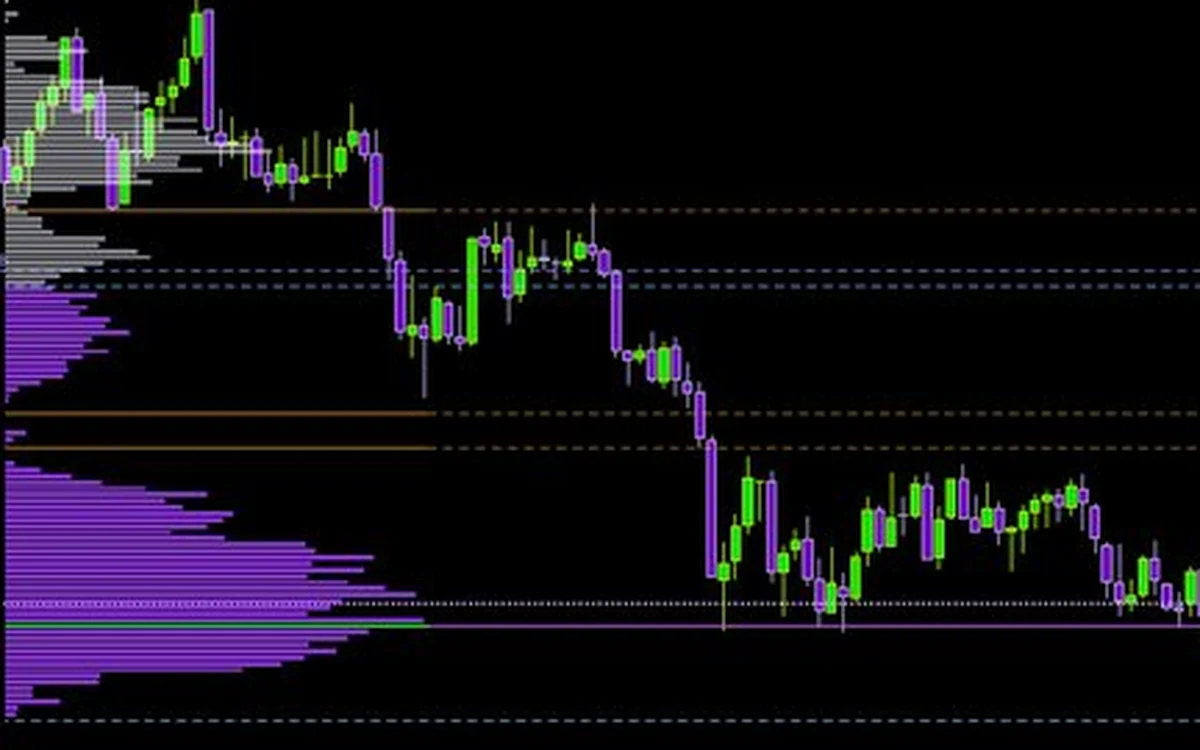
Drag a range to profile it; POC, value area and low-volume nodes extend until traded.
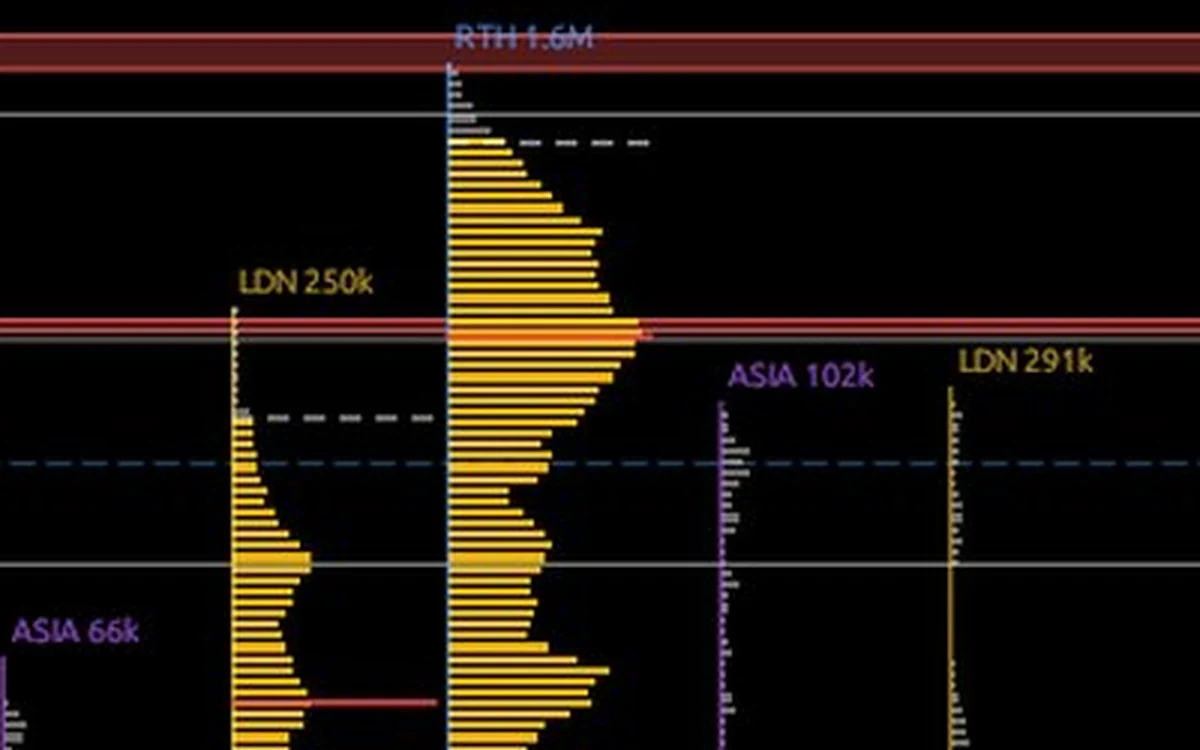
Asia, London and RTH profiles for each day, sized by session volume.
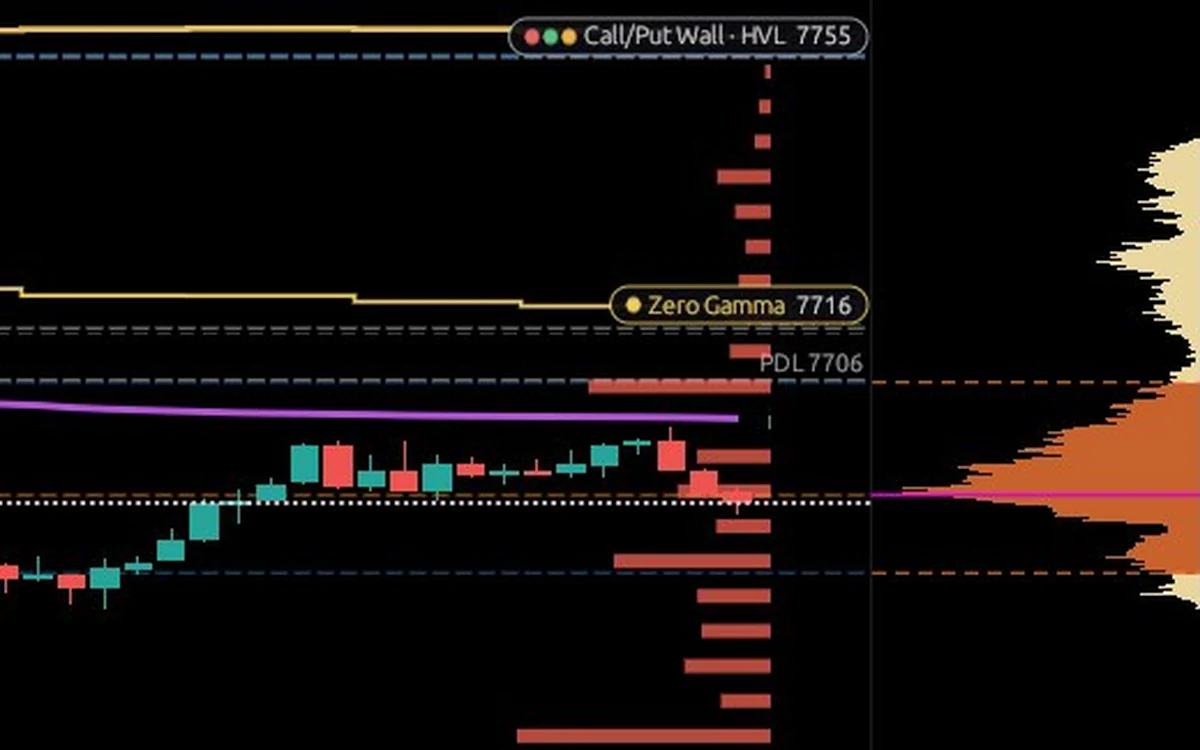
Dealer gamma levels and net GEX by strike, using Cboe options data.
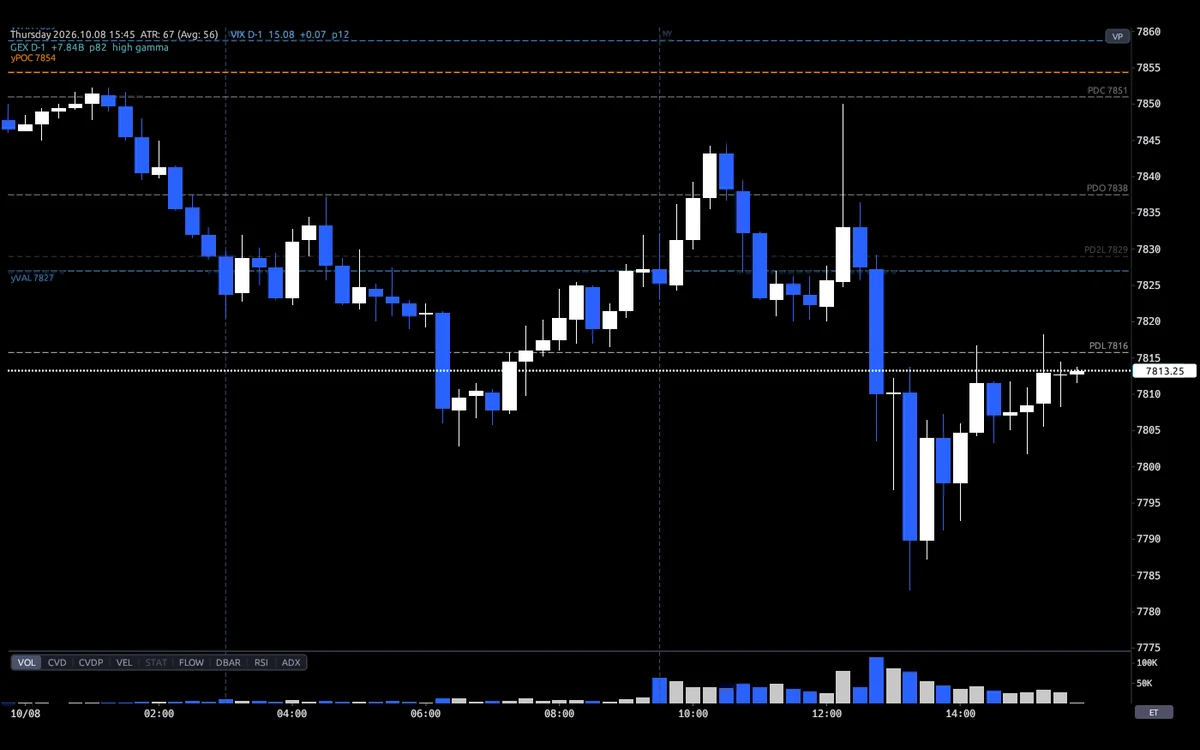
Previous-day levels, the overnight range and yesterday’s value area on your chart.
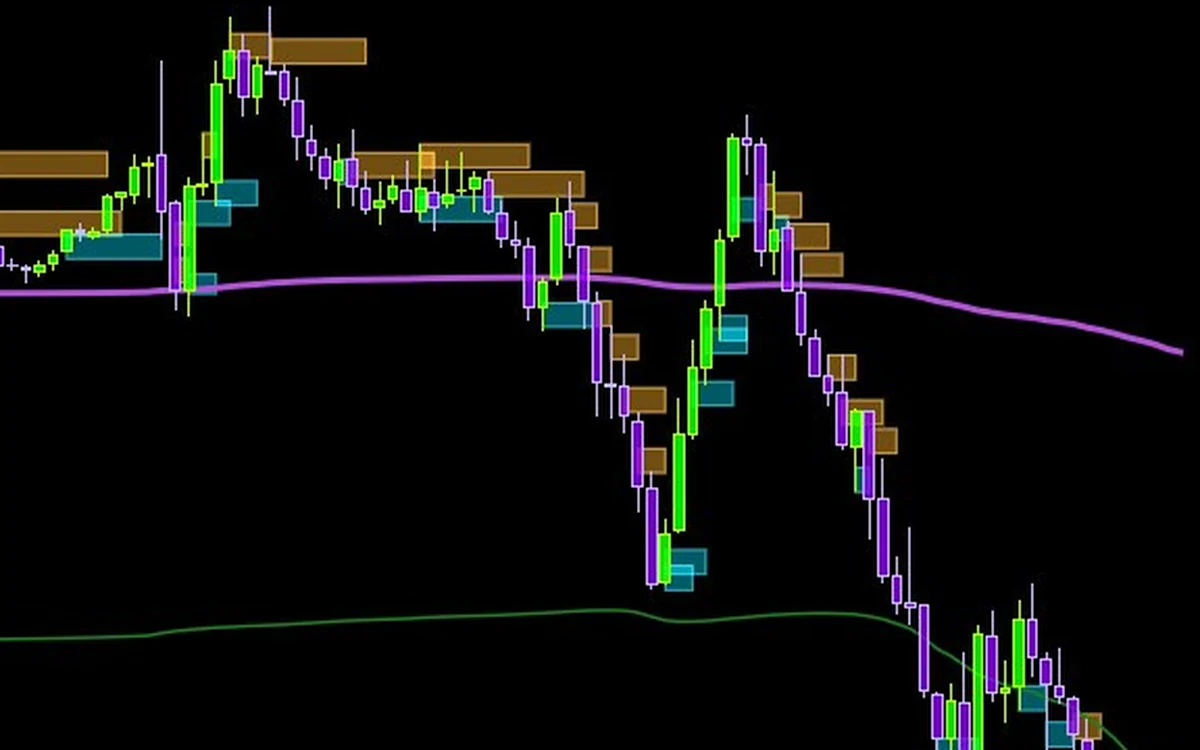
Pivot zones where aggressive flow turned, built from range bars of trades.
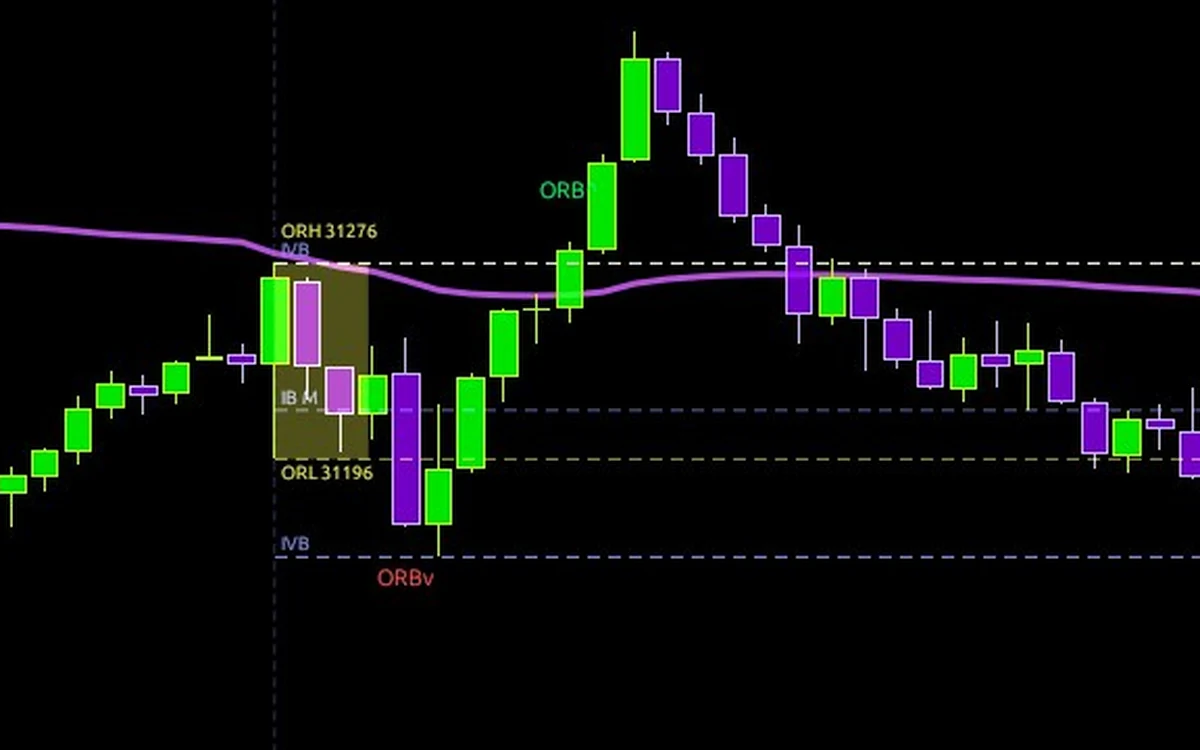
Initial balance high, low and midpoint, with past closes from the same session state.
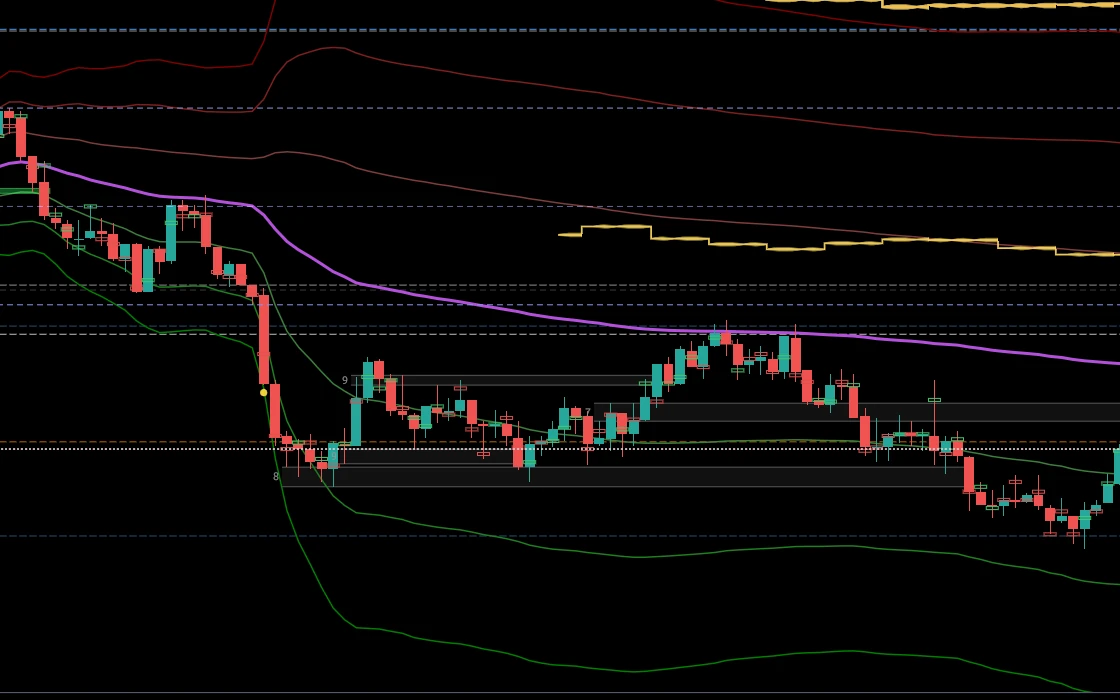
Session VWAP with one, two and three standard-deviation bands.
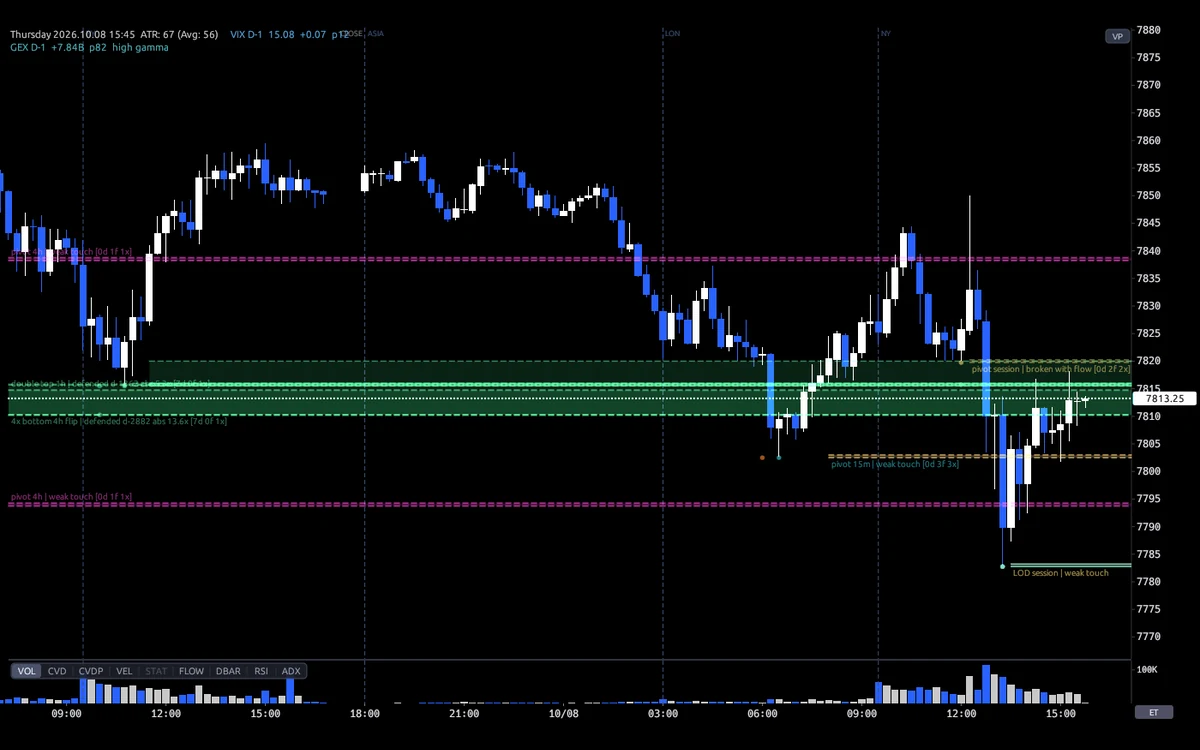
Double and triple tops and bottoms, from 5-minute to 4-hour pivots.
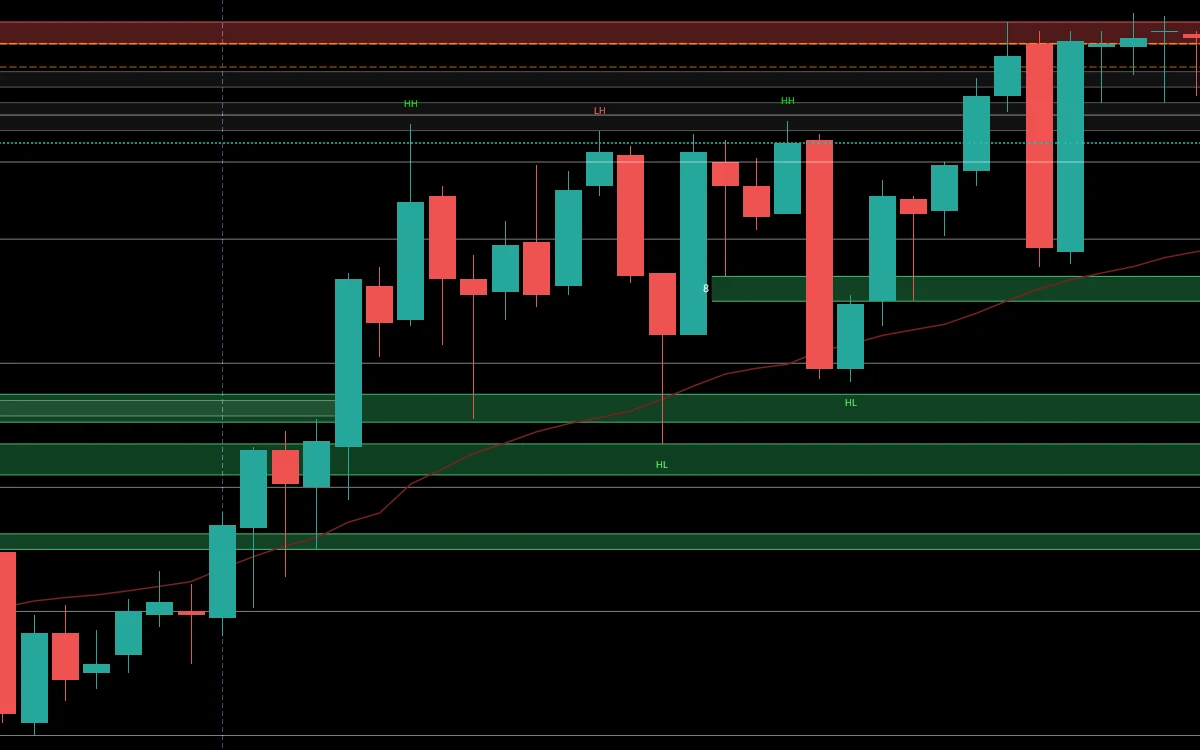
Repeated wick zones, fair value gaps and order blocks, drawn on price.
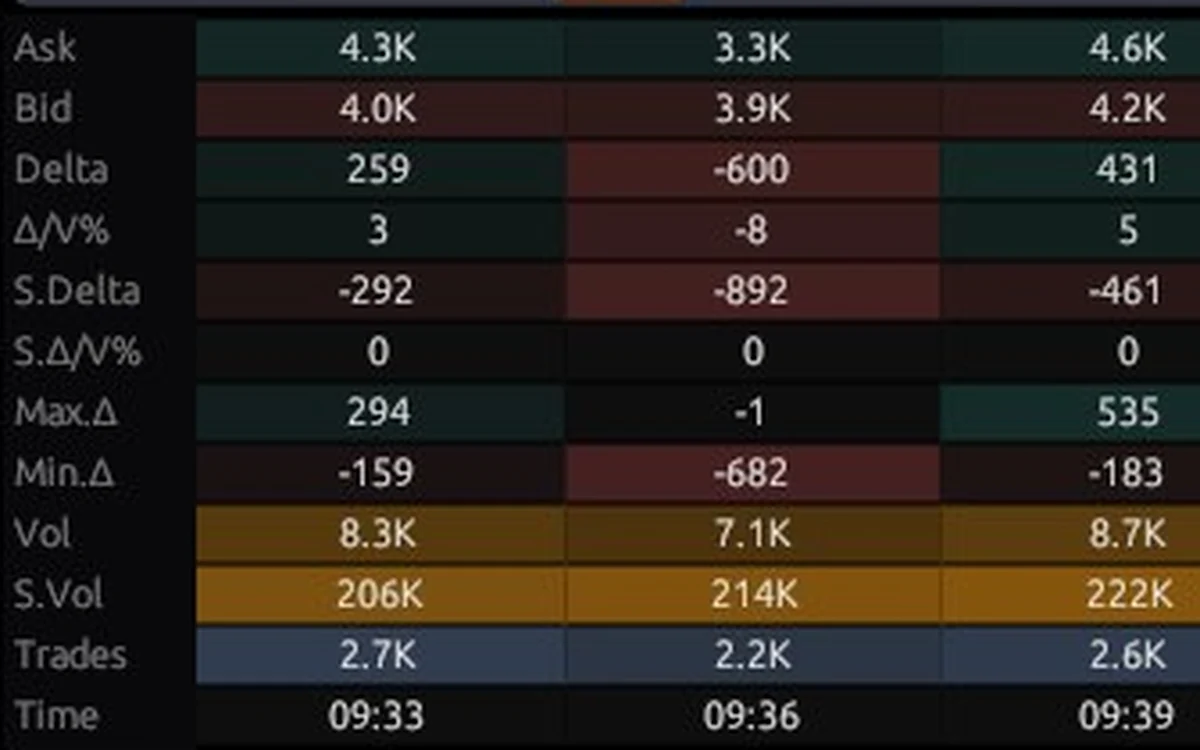
Ask, bid, delta, volume and trades for each candle, in a grid below price.
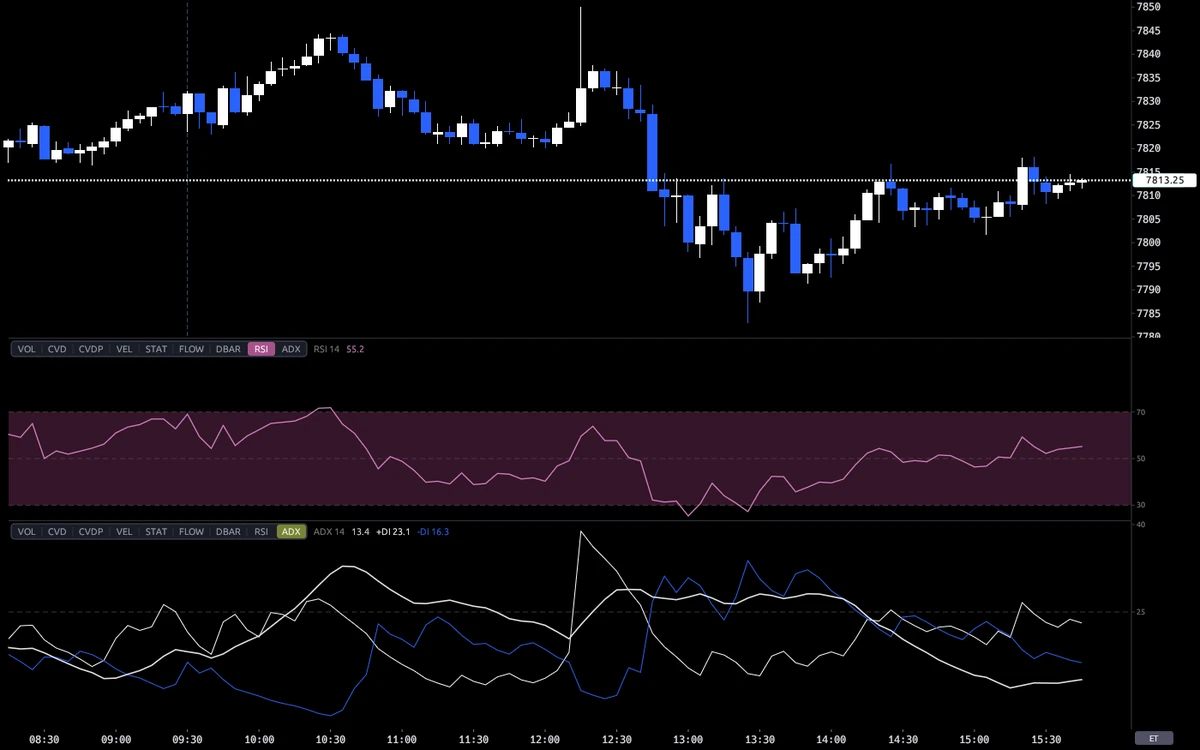
Wilder RSI and ADX with directional lines in the lower pane.
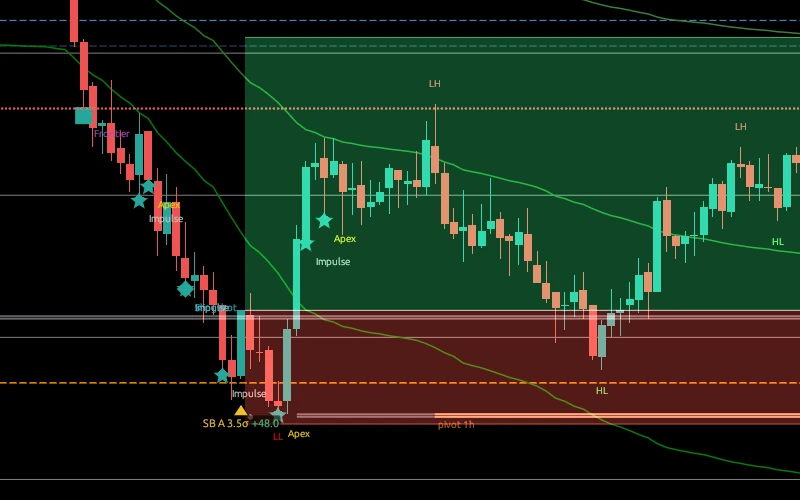
Marks a five-minute close stretched from VWAP with a rejection wick.
And more in the app.
Session levels, themes, economic calendar markers and drawing tools.
Replay & simulation
Replay any recorded day with future bars hidden. Practise in a simulator that applies prop-account rules for daily loss, drawdown and a target.
Simulation is not live trading.
Explore in early access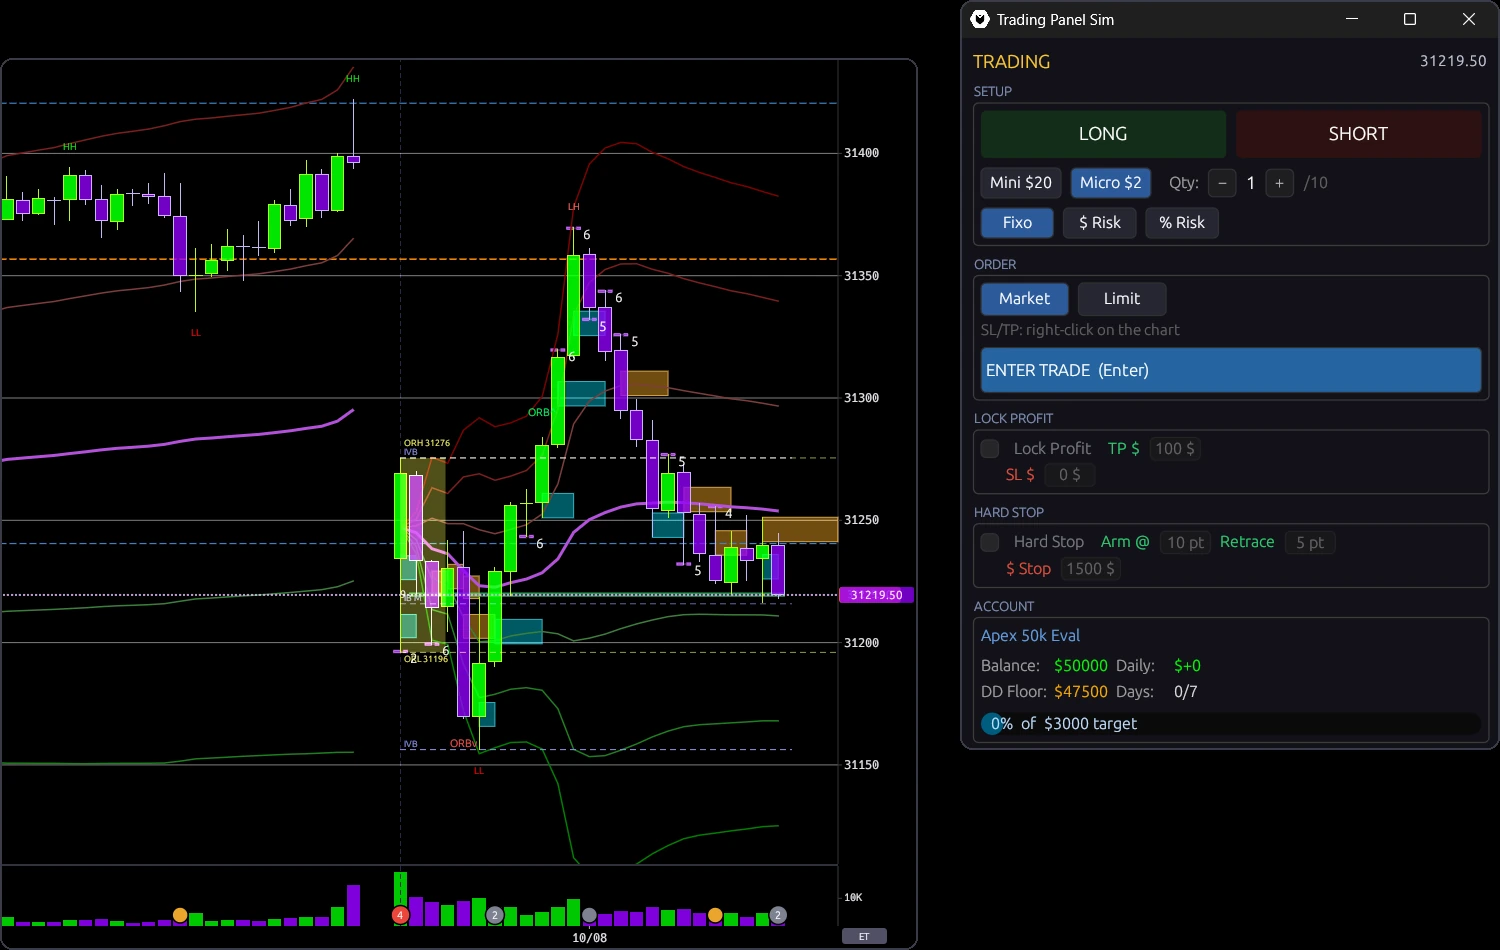
A few details about the charts, recorded data and early access.
A native Windows charting application for ES, NQ, MES and MNQ futures. It brings footprint charts, profiles, delta and contextual studies into one workspace. The product is currently in private testing.
Futures order flow uses CME Globex MDP 3.0 data via Databento. GEX studies use Cboe options data. The interactive example above is a recorded ES session from the DeepAlpha database; it is not a live feed.
Choose Footprint, Profiles, Big Trades or Delta, then drag the divider. With a keyboard, focus the divider and use the arrow keys; Shift moves it further. Home and End move to its limits. The arrows beside the tabs cycle through studies.
The nine chart timeframes are 1m, 2m, 3m, 5m, 15m, 30m, 1H, 4H and Daily. The recorded example on this page uses one-minute bars.
Replay a recorded day one bar at a time with future bars hidden. The simulator applies prop-account rules, including daily loss, drawdown and a target, with simulated rule sets for Apex and Lucid. It is practice in a simulation, not live trading.
DeepAlpha is in private testing. Join the early-access list to receive availability and launch updates. Joining the list does not guarantee access.
Currently in private testing
Join the waitlist for availability and launch updates.
No payment required. Read our .